Research
Analysis
Technical price structure, key levels, and trend direction — across Crypto, Precious Metals, Commodities, Stock Indices, and Macro Economics.
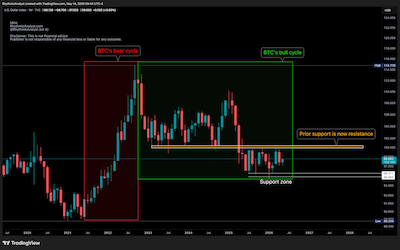
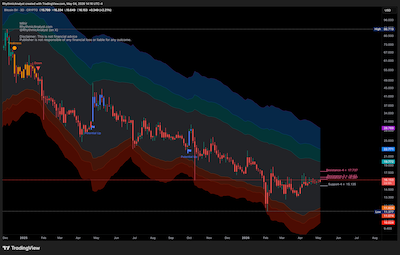
DXY and BTC Long-Term Cycle Relationship – The Inverse Macro Picture
DXY and Bitcoin have shown a strong inverse relationship over long cycles. With DXY struggling at key resistance for the last 10 months, here's what it means for BTC and crypto.
Trend Direction
▼ Down (Consolidating)
Read Analysis →
Brent Crude Oil: A Classic Case of Fundamental and Technical Analysis in Harmony
Crude oil surged on geopolitical headlines — but the charts were already moving higher months earlier. Discover how fundamentals and technical analysis are perfectly in sync right now.
Trend Direction
▲ Up (Weakening)
Read Analysis →
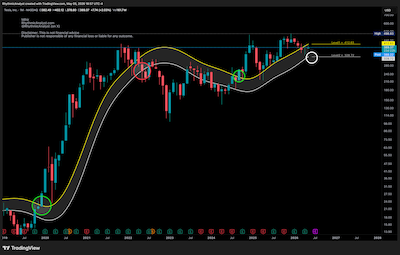
Tesla (TSLA) Technical Analysis
Tesla has shown powerful historical breakouts. See the current monthly levels, key support/resistance, and what the indicator says about the trend in this educational technical analysis.
Trend Direction
▲ Up
Read Analysis →
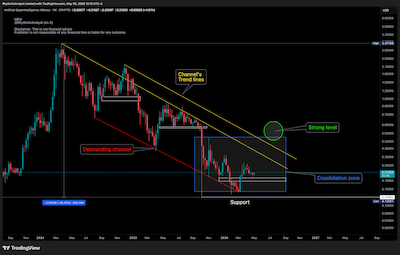
Understanding FET's Descending Channel and Key Levels
FET made a new ATH in 2024 when even Ethereum couldn't. Then came a shocking 96% crash. Now the chart is showing something different. Explore the descending channel, key levels, and what the current bounce means.
Trend Direction
▼ Down (Near Breakout ↑)
Read Analysis →
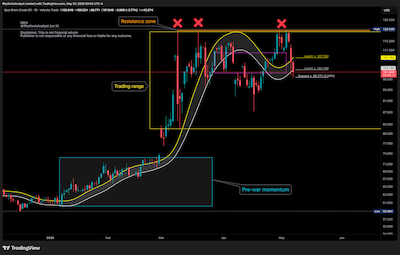
BSV: Downtrend Meets a Decision Point
BSV has been in a sustained downtrend since January 2025 after showing weakness near $50. It is now facing a major resistance zone. Discover what the Pulse service is highlighting in this focused technical analysis.
Trend Direction
▼ Down (Near Breakout ↑)
Read Analysis →

TAO at a Critical Technical Inflection Point – What the Charts Are Showing
After repeated tests of major resistance and a significant correction phase, TAO is displaying interesting technical developments. Explore the key patterns, volume behaviour, and important levels that could shape its next move.
Trend Direction
▲ Up
Read Analysis →
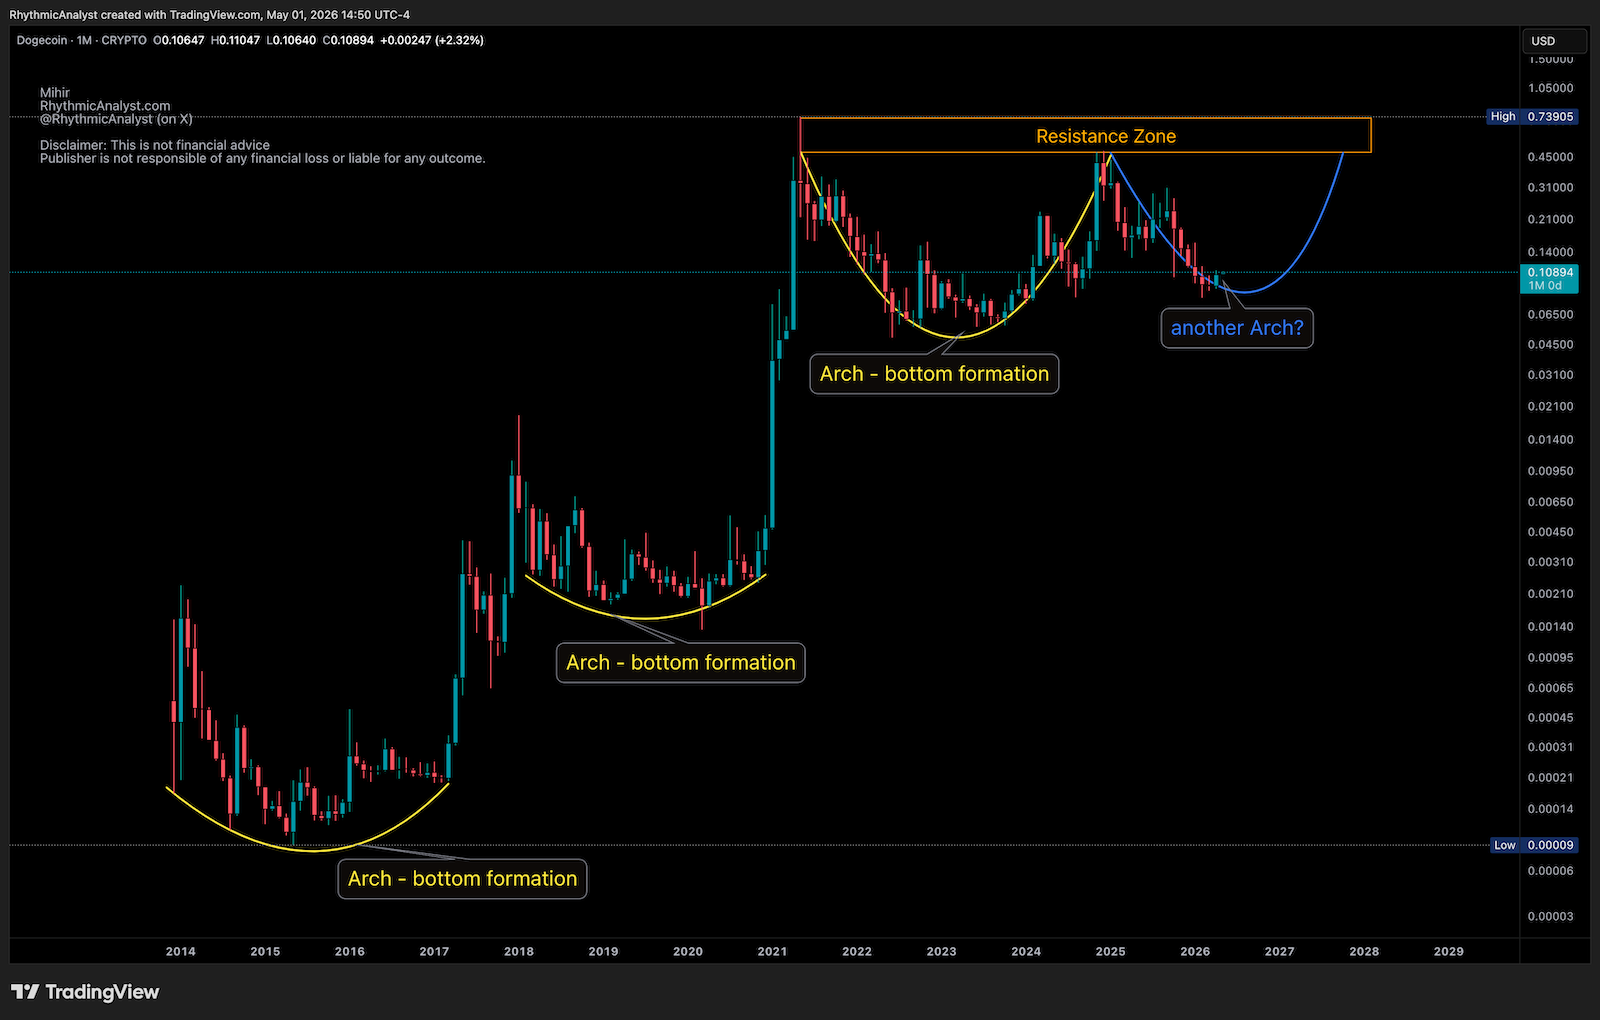
DOGE — Bottom Formation in an Arch Pattern
The last three months of price action indicate that selling pressure has eased as price has begun moving sideways — the first sign of strength.
Trend Direction
— Ranging
Read Analysis →
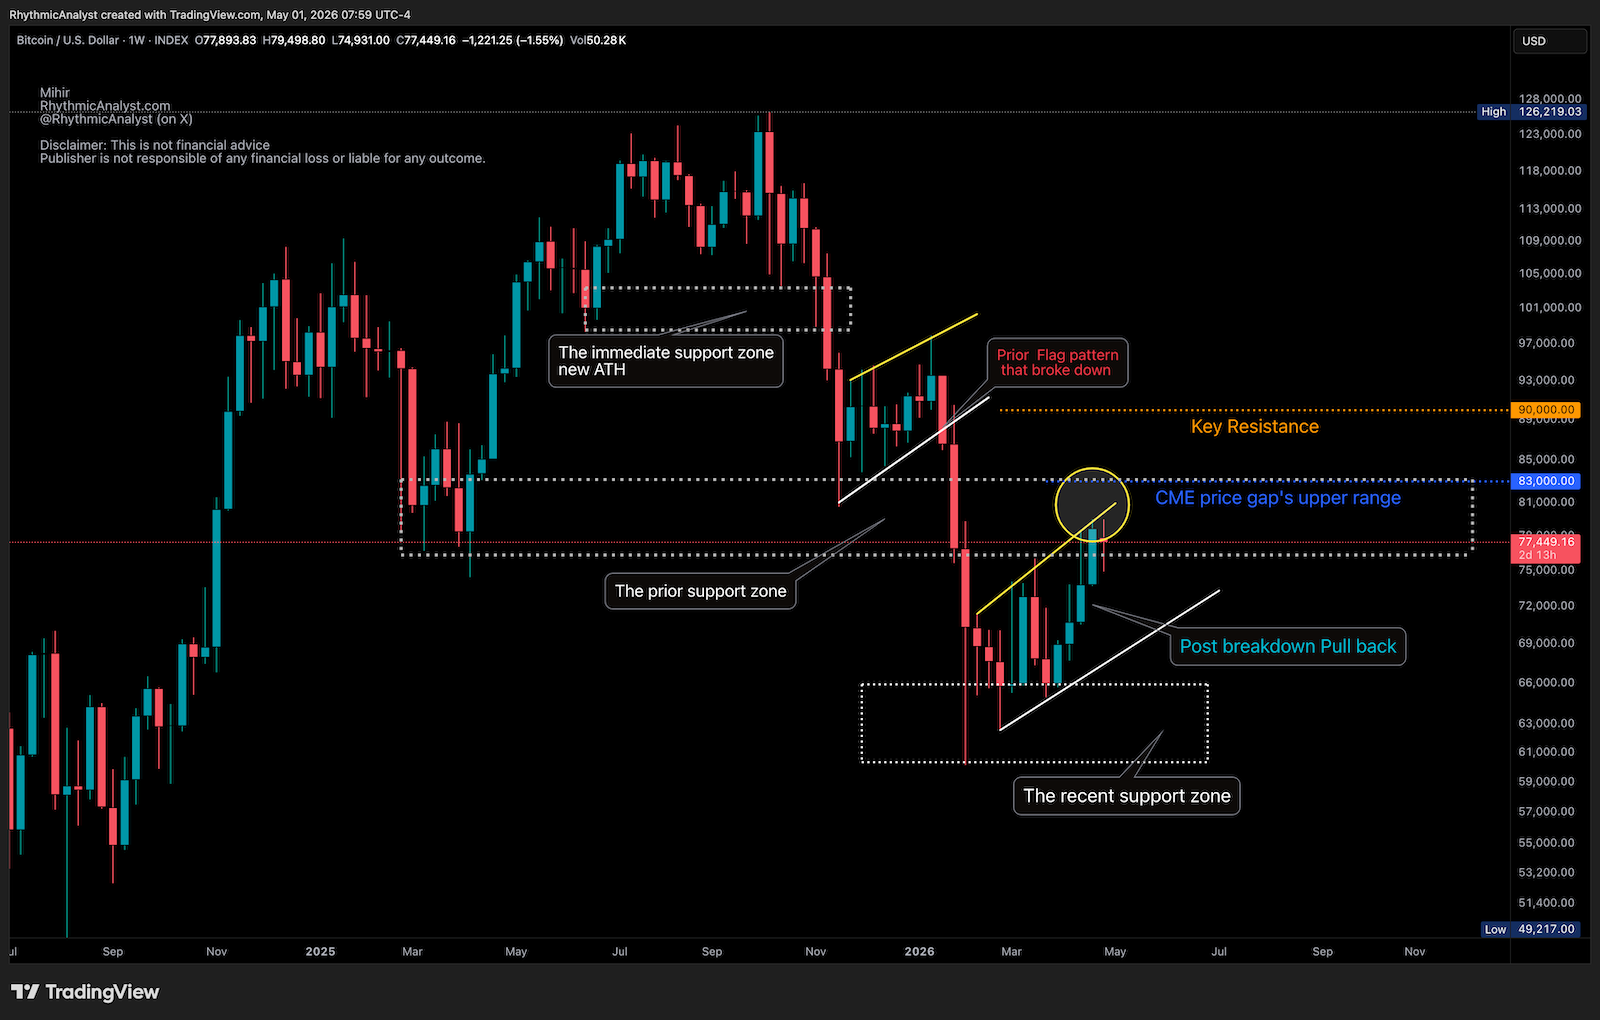
Bitcoin — Reclaiming Key Structure
BTC is holding above its January 2026 breakdown level, indicating underlying strength. Take a look at its key levels and trend analysis.
Trend Direction
— Ranging
Read Analysis →