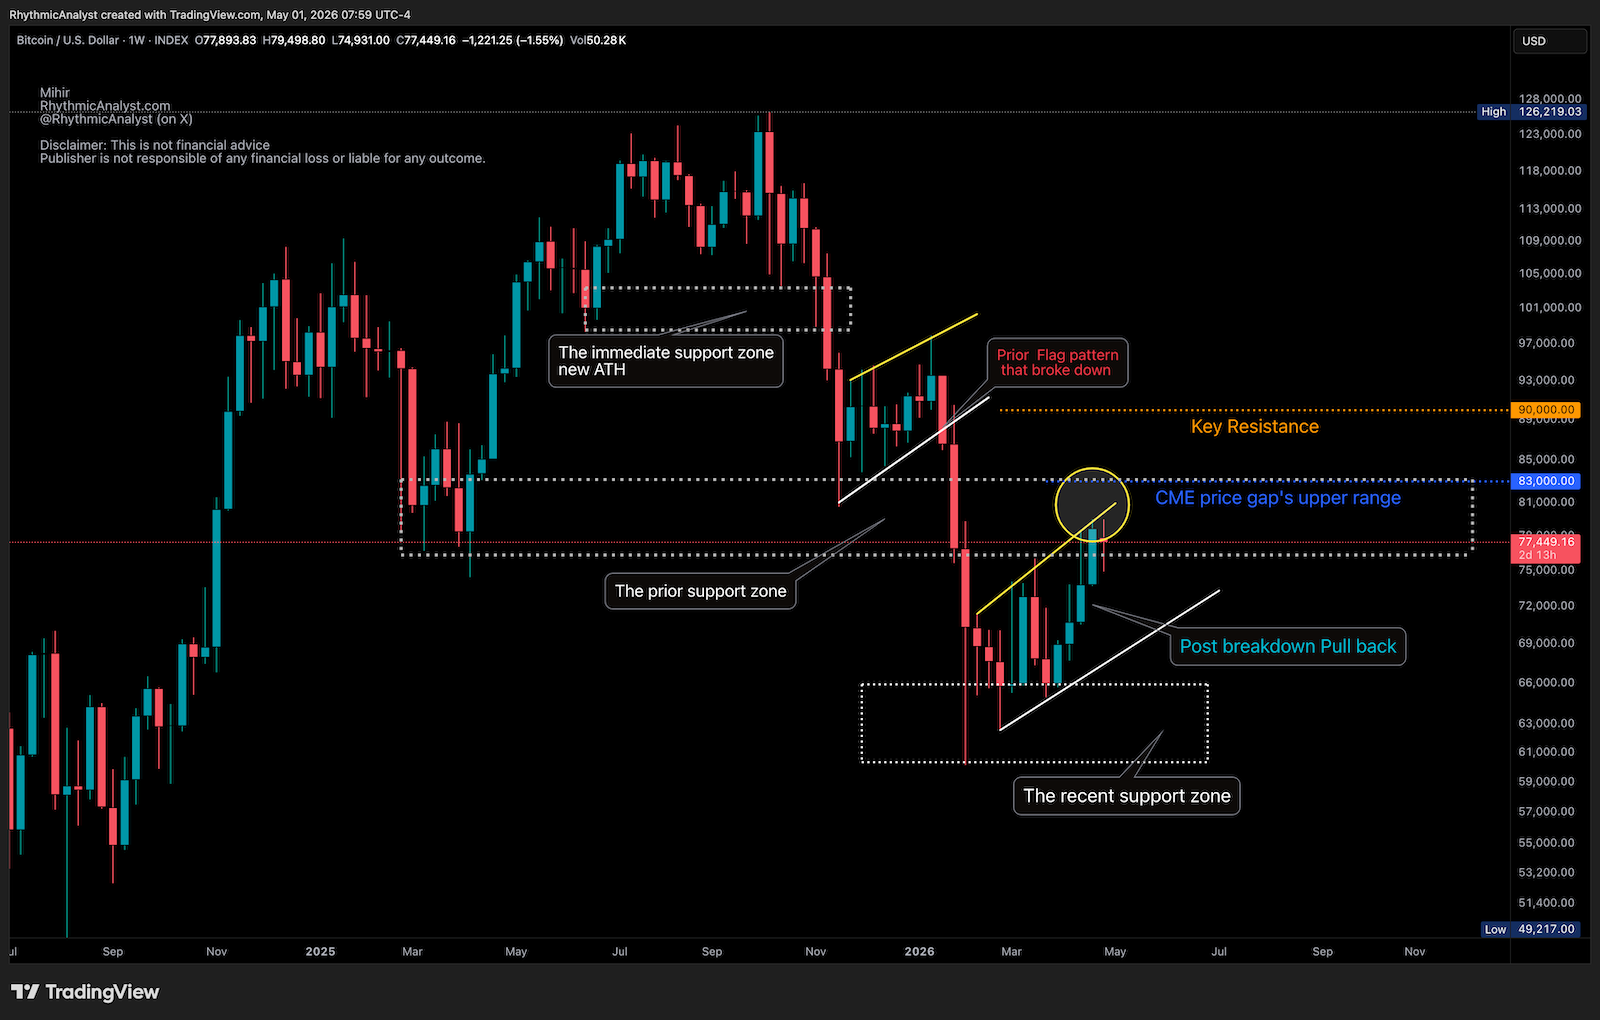
BTC began its correction in October 2025 after reaching an all-time high. Since then, two major support zones—around $98K and $76K—have helped absorb the drawdown. In February, the price tested the $60K support level, triggering market-wide panic, but rebounded quickly to $70K the following day on strong volume.
Since that rebound, BTC has traded in a range. Last week, it approached the CME weekly price gap, a level often viewed as significant resistance. Historically, such gaps tend to be filled. A mild retracement from this level is a typical market response. Currently, BTC is holding above its January 2026 breakdown level, indicating underlying strength.
The next key resistance lies near $90K, which serves as an important level for a potential continuation of the uptrend. As long as the $65K support holds, the current recovery phase remains constructive.