For Tesla stock, I'll keep it brief and let the chart do most of the talking.
Here are the key technical pointers on the monthly timeframe using my custom indicator:
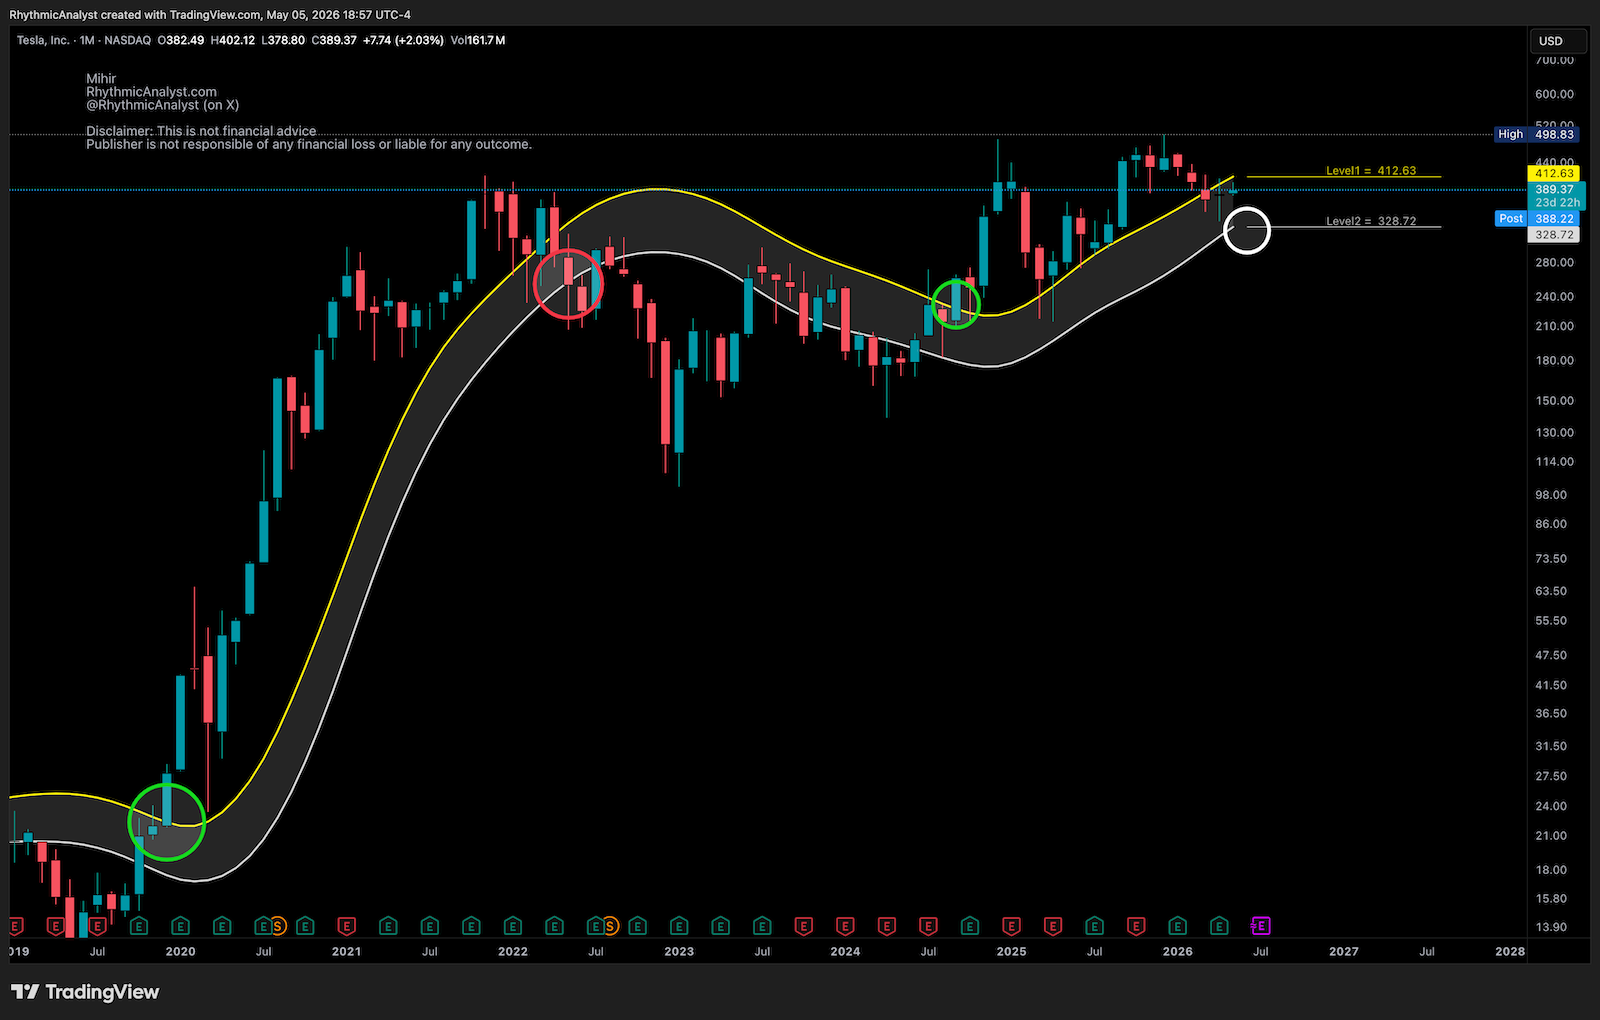
- Green circles highlight past upside breakouts: one near $27 in December 2019 and another near $265 in September 2024.
- The red circle near $250 marks the significant low in May 2022.
- In the last two months, price has tested Level-1 resistance (yellow line), currently near $412. This is the immediate resistance zone.
- A white circle marks Level-2 support near $328, which is the current key support area.
As per this indicator, the overall price trend remains up as long as price stays above Level-2.