Rhythmic Analyst covers BSV to provide educational insights for those who follow the asset — a coin that receives limited coverage from most technical analysts.
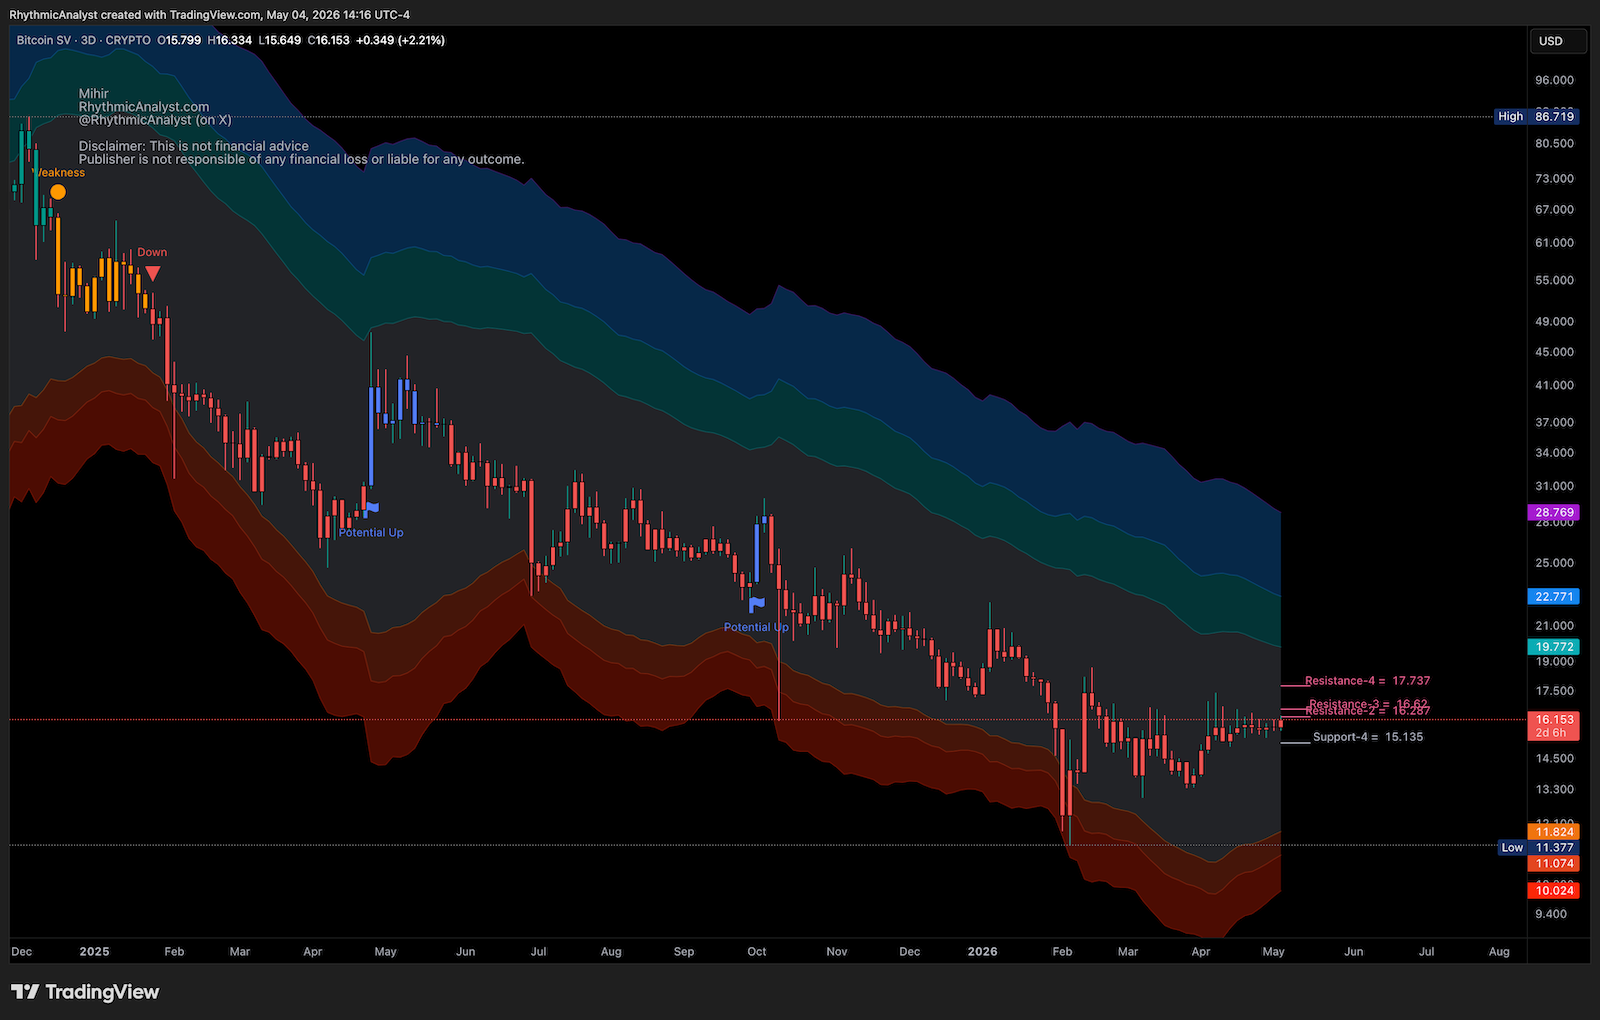
BSV showed clear weakness near the $50 level — visible in the upper-left area of the chart with the orange candles. The asset then entered a sustained downtrend starting in January 2025.
Since the downtrend began, price made two notable attempts to move higher but was unable to break above the R4 resistance level on either occasion.
The key resistance (R4) is currently situated near $17.74. A move above $18 would be required to convincingly clear this zone and shift the near-term structure.
This update is based on the custom indicator used in the Pulse paid technical analysis service — learn more about Pulse.